
The problem: data that hides more than it reveals
Too much telemetry, too few answers. Fleets collect streams of location pings, engine codes, fuel snapshots, driver events — and still operators wake to surprises: broken vehicles, missed windows, sudden cost spikes. A clear reporting strategy starts by admitting the problem: raw volume without decision logic creates blind spots. For teams trying to regain control, a focused fleet management solution must act like a sieve, not a storage locker. I’ve seen municipal routes in New York City turned brittle by reports that tracked everything except what mattered.

Problem-driven priorities: the handful of metrics that cut through noise
Pick metrics that force action. Track these because they cause operational failures if ignored:- Vehicle availability: true on-route time versus scheduled time, flagged for immediate follow-up.- Unscheduled maintenance indicators: coolant fault codes, rising oil pressure, and predictive alerts before a breakdown.- Fuel variance per route: regular baseline versus real-time consumption, with sudden deviations flagged.- Idle and speed behavior: idle minutes and repeated harsh braking correlate with fuel waste and wear.- Route adherence and time-on-task: missed stops, repeat detours, and unexpected layovers that erode service promises.Each metric must map to a specific corrective step, a named owner, and a window for resolution. Tracking for curiosity is wasteful; tracking for fixes saves budget and reputation.
Reporting that exposes failure modes, not just performance
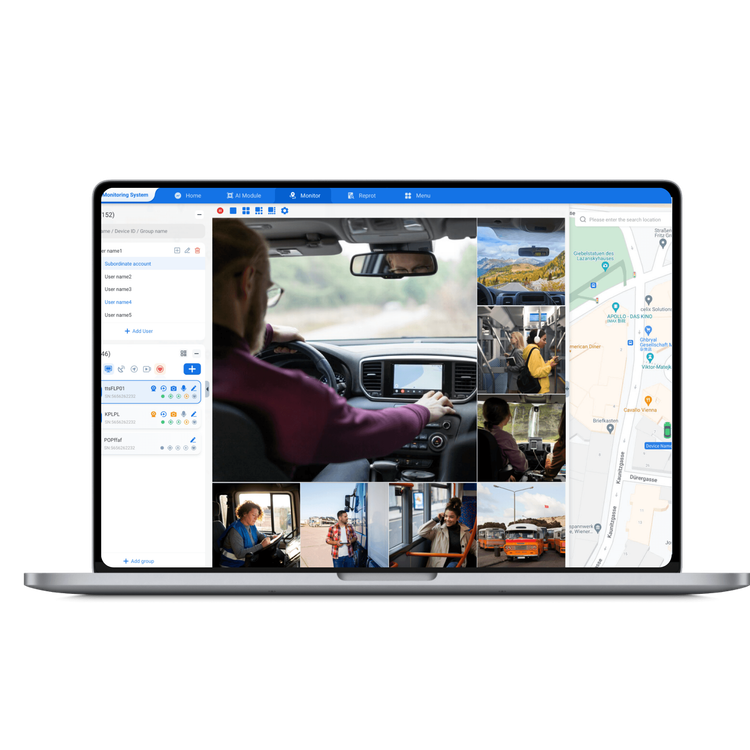
Reports should reveal why problems happen. Examples of reporting design that work:- Incident timelines: stitch events (telemetry, driver input, maintenance history) into a single sequence so root causes become visible.- Cohort comparisons: compare similar vehicles, routes, or shifts to isolate outliers fast.- Exception-first dashboards: surface the top 10 items that need attention — instead of a thousand charts that require interpretation.Avoid monthly roll-ups that arrive after the damage is done. Set cadence by decision: daily for dispatch fixes, weekly for maintenance planning, monthly for strategy — only if each cadence links to an action.
Data hygiene and model trust: the quiet, urgent work
Bad inputs breed false alarms and apathy. Validate incoming feeds, tag uncertain readings, and mark imputed values clearly. Keep these rules:- Timestamp alignment: ensure GPS, engine, and ticketing times sync to one clock.- Confidence scoring: every metric carries a trust rating; low-confidence items trigger verification, not blind fixes.- Minimal transforms at ingestion: preserve raw signals for audits; compute aggregates in controlled layers.A platform must let analysts rewind and test assumptions. When models produce recommendations, operators should see the supporting evidence, not only the suggestion.
Where teams typically fail
Common, repeating mistakes:- Chasing completeness over clarity: more fields don’t equal better choices.- Building vanity KPIs that feel good to report but don’t change outcomes.- Ignoring edge cases: seasonal shifts, extreme weather, and oddball routes break models if not considered.- Centralizing dashboards without creating local ownership — the people on the ground must have feeds they trust and time to act.Correct these by linking each metric to a human decision, and by training frontline staff to interpret the exceptions that affect their shift.
Tool expectations and practical trade-offs
Platforms should prioritize live flags, explainable trends, and simple controls for thresholds. Expect trade-offs:- Granularity versus signal-to-noise: higher frequency helps troubleshooting but raises false positive risk.- Automation versus human review: auto-scheduled maintenance saves time, but require manual checks for critical systems.When choosing or evaluating a system, verify it can deliver both operational alerts and the forensic data for post-incident review. Integrations must be configurable; teams need to route incidents to existing workflows for repair or safety training. Good software supports these moves without imposing rigid processes on people who already carry risk on the road.
Decision checklist before you build reports
Use this checklist to stop wasting reports:- Is there a named owner for the metric’s follow-up? If not, don’t track it.- Can an action be taken within the next shift when the metric flags? If not, deprioritize.- Is the data trusted enough to trigger an automated step? If not, add a verification stage.- Does the report reduce a recurring cost or risk? If not, make it a secondary view.Link the outputs back into daily workflows. A dashboard that sits unread is a ledger of broken promises. Consider how your chosen fleet management feeds into those workflows before you scale reporting.
Closure: where problem-solving meets systems
The problem-driven path ends with clear responsibilities and fewer surprises. Track what forces action, enforce data trust, and set reports to demand response. When teams do this, their dashboards stop being grim lists and start being maps for repair. That practical clarity — serviceable, testable, accountable — is the quiet value that matters most, the kind of discipline a pragmatic partner like BSJ helps embed into routine operations so decisions happen before the next failure.