Introduction: Why This Matters — and Who Pays Attention?
Have you ever stood at a transit depot watching a bus zip in and out and wondered why recharging still looks like a chore? I ask because the numbers are blunt: fleet operators report downtime costs that often outweigh energy bills. The pantograph charger is meant to fix that — rapid overhead contact for quick top-ups — yet the promise and reality often diverge (and yes, that frustrates me as well).
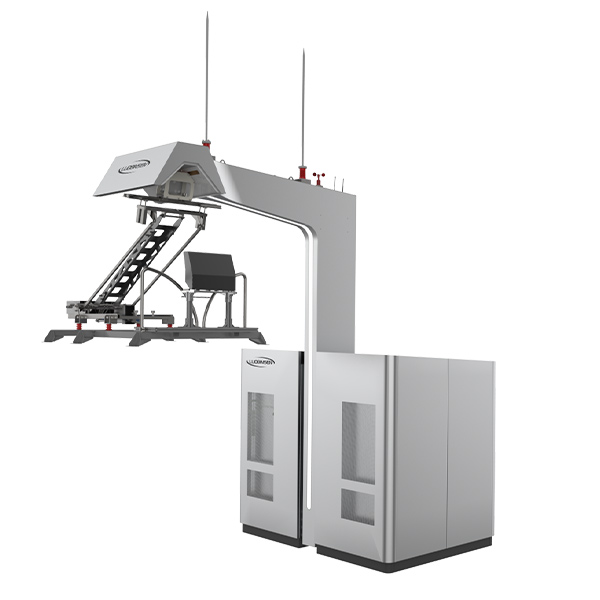
Scenario: city depots trying to keep dozens of buses moving during peak hours. Data: studies show unscheduled charging and connector faults can shave 10–20% off fleet availability. Question: are pantograph systems delivering the throughput and reliability operators expect, or are hidden issues eating the gains? This article compares practical trade-offs, draws on real pain points, and offers usable criteria so you — as a planner, operator or engineer — can make clearer choices. Let’s move into where the problems actually hide.
Part 1 — Deeper Layer: Where Traditional Solutions Fall Short
What common failures are we missing?
I’ll say it plainly: many deployments treat pantograph EV hardware as a plug-and-play fix. But when we drill into operations, serious gaps appear. For starters, pantograph ev charging setups often assume perfect alignment and predictable schedules. Reality throws variable dwell times, mixed vehicle heights, and inconsistent driver behaviour at the system. Combine that with aging contact strips and limited diagnostic telemetry, and small faults cascade into long delays. From a systems view — power converters, contact strip wear, and intermittent overhead current collection are the usual culprits.
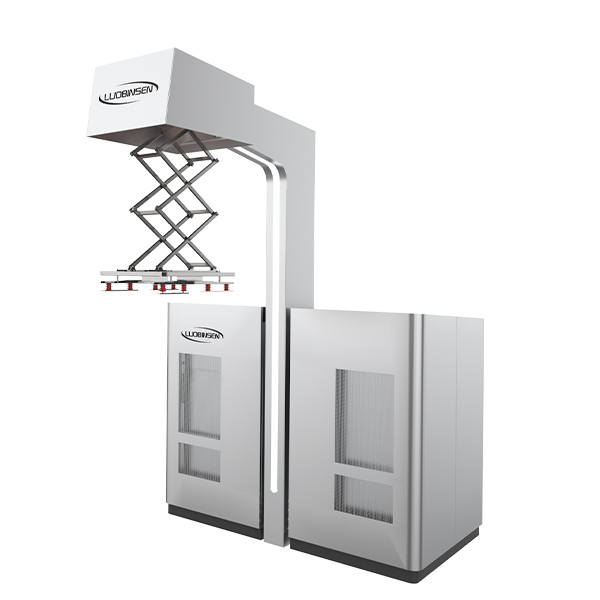
Look, it’s simpler than you think: a high-throughput headline number for kW means little if the charger can’t tolerate misalignment or if control firmware can’t prioritise urgent vehicles. I’ve seen charging infrastructure where control logic favours longest-wait vehicles, but the real cost was lost throughput because of frequent manual re-docks. The pain point? Operators lose predictability. Passengers notice. That unpredictability is costly — both financially and reputationally. We need better fault-tolerant design, smarter telemetry, and clearer human-centred procedures — not just higher peak power numbers.
Part 2 — Looking Forward: Principles for Better Pantograph Systems
What should next-generation systems prioritise?
Now let’s flip from problems to principles. When I evaluate new designs I look for three core ideas: graceful tolerance to misalignment, adaptive power management, and layered diagnostics. A good pantograph EV charging system — and yes, I mean both hardware and software together — will include position-sensing (to compensate small offsets), robust power electronics (to handle surges without tripping), and remote telemetry that surfaces actionable faults before operators react. Those features cut downtime, reduce manual interventions, and improve lifecycle costs.
Technically, this means tighter integration between edge computing nodes at the depot and central fleet management. Real-time data (temperature of contact strip, arm actuator cycles, voltage ripple on power converters) enables predictive maintenance. Also, consider modular designs: replace a worn contact instead of a full unit swap. Case in point — one transit pilot I observed reduced unscheduled service by 30% after adding simple alignment sensors and automated retries. Small changes, big impact — funny how that works, right?
Final Thoughts — How to Choose: Three Metrics That Actually Matter
We’ve covered faults and future principles; now let me offer three practical metrics I use when weighing pantograph options. First: effective throughput — not just peak kW, but average charged energy per scheduled stop (this factors in dock time and alignment). Second: mean time to recover (MTTR) — how fast can a system auto-recover or be serviced when a fault occurs? Third: diagnostic transparency — the percentage of faults that can be resolved remotely versus those requiring on-site intervention. These metrics map directly to fleet uptime and operating cost.
When you evaluate vendors, ask for real operational logs, not polished bench tests. Demand to see time-series data: contact resistance trends, frequency of actuator retries, and grid interaction events. And trust your instincts — if a sales pitch fixes on headline power but dodges MTTR questions, proceed cautiously. I’ve been in rooms where glossy specs outshone hard answers; I prefer honest trade-offs. — and yes, that matters in procurement conversations.
In closing, choosing the right pantograph route is about balancing speed with resilience. If you want throughput, demand tolerance and telemetry. If you want low maintenance, prioritise modular components and clear diagnostics. For further technical resources and product details, consider reviewing options from Luobisnen — they compile practical spec sheets that help teams compare real-world performance rather than just peak numbers.