Measure the pain: what to quantify first
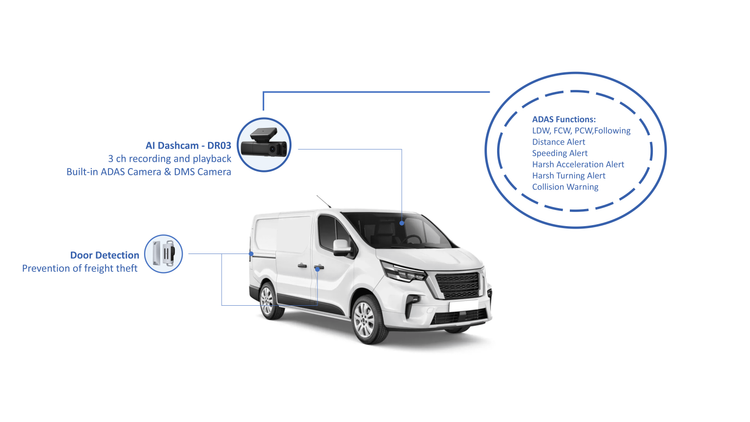
Start with baseline numbers and treat them as the experiment. Track stop density, mean stops per route, average dwell time per stop, on-time delivery rate, empty miles percentage, and vehicle utilization. These core metrics make performance comparable across days, drivers, and neighborhoods; they also reveal where routing and dispatch decisions matter most. Integrate telematics and order data into a single view so you can compare before/after changes in real terms. For practical deployment, connect telematics feeds to your logistics fleet management dataset and run daily aggregations to detect drift. New York City offers a clear operating context where high stop density and tight time windows expose the weakest parts of a van fleet model.
Which levers move the needle (metrics-driven)
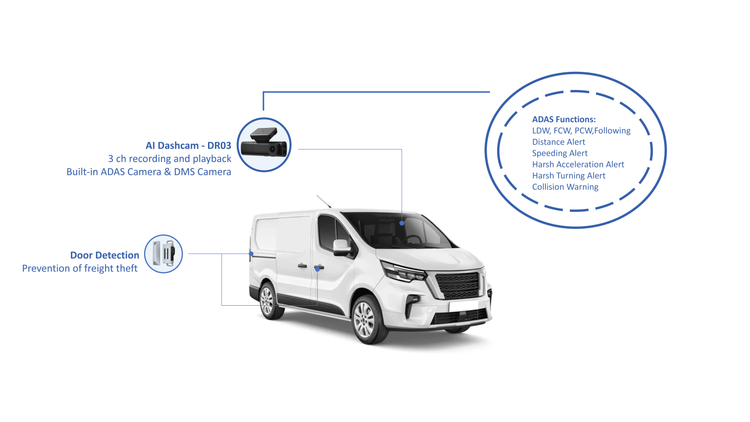
Prioritize levers by expected impact and implementation risk. Quantify expected gains before you act.- Dynamic dispatch and clustering: lower route length and idle time. Estimate impact by simulating current routes vs. cluster-optimized routes.- Predictive maintenance: reduce unexpected downtime by monitoring engine hours and fault codes; calculate mean time between failures and aim for a measurable increase.- Load sequencing and stop priority: reduce dwell time per stop by sequencing high-volume addresses earlier in the route.- Real-time reoptimization: measure percentage of reroutes that reduce ETA variance.Run A/B pilots with a control group of drivers to isolate causal effects; report lift as absolute percentage point changes (e.g., on-time +X pp) rather than vague “improvements.”
How to test models without disrupting operations
Design short pilots with clear hypotheses and failure criteria. Example framework:- Hypothesis: dynamic dispatch reduces miles per delivery by at least 8%.- Sample: 10 vans for two weeks with matched control vans.- Data: second-by-second GPS, door-open events, timestamped deliveries.- Success threshold: statistically significant reduction in miles per delivery at p < 0.05.Keep pilots local and time-boxed. Use driver feedback as a secondary metric but rely on telemetry for primary results.
Common pitfalls that invalidate analysis
Avoid these mistakes that produce misleading conclusions:- Comparing different demand shapes (weekend vs. weekday) without normalization.- Ignoring driver behavior heterogeneity; one high-performing driver can skew averages.- Using coarse GPS sampling that misses short detours and inflate idle estimates.- Optimizing solely for distance; time-window violations and customer experience matter.Document each data assumption and log any manual interventions during tests so you can reproduce results.
Platform choices: trade-offs and practical criteria
Assess options by integration difficulty, data access, model sophistication, and operational fit. Consider three paths:- Build: full control, higher upfront cost, needs data engineers and operations analysts.- Buy best-of-breed telematics plus homegrown dispatch: faster telematics data, more work to unify scheduling.- Buy integrated SaaS: quicker ROI but limited customizability.Prioritize vendors that expose raw event streams and APIs so your analytics remain reproducible. When evaluating, check how each provider supports both routing and fleet health—true operational value comes when routing and maintenance data sit together in the same pipeline for joint analysis of downtime and service impact. A practical evaluation should include a short integration test feeding live events into your analytics layer for one week to validate latency and completeness of data for logistics and fleet management use cases.

Implementation checklist and governance
Follow this stepwise checklist:- Baseline: collect 2–4 weeks of telemetry and order data.- Define KPIs with numeric targets and failure criteria.- Pilot: run matched control experiments for 2–4 weeks.- Evaluate: use statistical tests and driver-level diagnostics.- Scale: roll out in defined cohorts with monitoring dashboards.- Governance: assign a data owner, a fleet operations owner, and a cadence for reviews.Log and version all model changes; tie performance slippage alerts to a rollback plan so operations never rely on an unvalidated change.
Final synthesis
Numbers define decisions: quantify the biggest sources of cost and variability, test targeted interventions with controlled pilots, and choose platforms that provide raw data and open APIs. The result is repeatable, auditable improvement in delivery predictability and unit cost per stop. For teams that need an integrated sensor-to-analytics path and pragmatic deployment support, BSJ folds operational telemetry into analytics pipelines so decisions are driven by data you can trust.